Friday, June 28, 2013

TRIG SUM AND DIFFERENCE IDENTITIES

THE RHYTHM OF TRIG SUM & DIFFERENCE IDENTITIES

               Sin (A + B) = Sin A Cos B + Cos A Sin B
               Sin (A - B) = Sin A Cos B - Cos A Sin B
               Cos (A + B) = Cos A Cos B - Sin A Sin B
               Cos (A - B) = Cos A Cos B + Sin A Sin B
               Tan (A + B) =   Tan A + Tan B 
                                      1 - Tan A Tan B
               Tan (A - B) =   Tan A - Tan B 
                                      1 + Tan A Tan B

It’s no surprise to find a teenager listening to music while studying.  There are two ways to recognize a familiar tune: the notes and the rhythm.  Try it. 

Play the notes and try to identify the song:


Did you recognize Mary Had a Little Lamb?  Even without the quarter notes, half notes, and measures, you would still know the tune.

Try this one with just the pacing:


 The "merrily, merrily, merrily, merrily" probably gave away that this one is Row-Row-Row Your Boat.  If you recognized it, try using rhythm to remember the Trig Sum and Difference Identities.

First, establish the pattern of syllables.  Then clap or tap the syllables for each word.

     Sin (A +/- B) = Sin A Cos B +/- Cos A Sin B

Read this as    SINE  COSINE      COSINE       SIN
Tap it out as    CLAP  CLAP-CLAP CLAP-CLAP CLAP

Once you know the rhythm you can write out sin and cos, fill in the A’s, B’s, and plus or minus symbols. 

     Cos (A +/- B) = Cos A Cos B -/+ Sin A Sin B

    Read as          COSINE        COSINE         SINE     SINE
    Tap it out as     CLAP-CLAP   CLAP-CLAP    CLAP    CLAP

    and fill in the angles and minus or plus.

Notice with these two identities, Sine sum or difference start with ‘sine’ and Cosine sum or difference start with ‘cosine’.  In addition, the Sine formulas have the same sign (+ or -) as the computation of the angles, while Cosines are opposite.

     Tan (A +/- B) =    Tan A +/- Tan B
                               1 -/+ Tan A Tan B


    Read as           TAN      TAN       ONE  TANTAN
    Tap it out as      CLAP   CLAP     CLAP-CLAP-CLAP

When filling in operations, notice that Tangent is Sine over Cosine, so the numerator maintains the operation on the angles but the denominator uses the opposites.

Once you know these identities, you won't have to learn the Double Angle Identities because you could just substitute (A + A) for (A + B). Each Sum and Difference equation can do double duty.  And who wouldn't like the requirement to learn half as much?!?

----------------------------------------------------------------------------

PRACTICE

These exercises obviously take liberties with musical notations, but tap out the rhythms and use an unexpectedl part of your brain to remember the Sum and Difference Identities.


TANGENT:
Tan Tan OneTanTan


SINE:
Sine Cosine Cosine Sine


COSINE: Cosine Cosine Sine Sine


Thursday, June 27, 2013

PARTIAL FRACTIONS, the basics

WHY DO WE STUDY PARTIAL FRACTIONS IN ALGEBRA AND PRECALCULUS?

In the early days of Algebra study, we covered “collect like terms” so that the process would be a simple step once we got to FOIL (also called “double distributive” in some schools).  The same thinking encourages us to learn other basic algebraic steps before using them in more complicated mathematics.  In Calculus, we may need to decompose rational expressions before applying the rules of integration.  By doing the initial algebraic work of decomposition now, higher level concepts will be easier to learn and understand.

There are several situations which may be presented in Partial Fraction exercises.  We’ll start with the simple and work toward the more complex.

Simple rational expression:

                2x + 3      
          (x^2 - 7x +10)        Notice that the degree of the numerator is smaller than the degree of the denominator.  This is an important restriction that must be met.  (see below: “What if the Numerator is a higher degree than the Denominator?”)

    STEP 1 - factor the denominator

              2x + 3  
            (x-2)(x-5)

    STEP 2 - using the factors from the denominator, list separate fractions to form an equation. (We don’t know the numerators yet, so let’s just keep them blank until Step 3).

              2x + 3         ?         ?  
            (x-2)(x-5)= (x-2) + (x-5)

    STEP 3 - Substitute letters for the unknown numerators.

              2x + 3         A         B  
            (x-2)(x-5) = (x-2) + (x-5)

    STEP 4 - Expand the right side to have a common denominator.

              2x + 3       A(x-5) + B(x-2)
            (x-2)(x-5) =      (x-2)(x-5)

    STEP 5 - Since denominators on both sides of the equation are the same, set the numerators equal and distribute A and B.
   
              2x + 3    =  Ax - A5 + Bx - 2B

    STEP 6 - Collect like variable terms.

              2x + 3   = (A + B)x - 5A - 2B

    STEP 7 - Create a system of equations by setting coefficients of the variables equal.

            2  = A + B
            3  = -5A -2B 
The reason I prefer this ‘systems’ method to some others is that I can use the matrix function on my calculator to get answers with only a few key strokes and no manual arithmetic.

    STEP 8 - Solve the system.

            A = -7/3
            B = 13/3

    STEP 9 - Seems like a lot of steps so far, but this is the last one.  Substitute A and B values into the equation from Step 3.

              2x + 3         -7/3      13/3 
            (x-2)(x-5) =  (x-2) +  (x-5)


WHAT ABOUT MORE COMPLEX DENOMINATORS?             
  
More factors?  Include more fractions in Step 3....
   
                 2x + 3              A         B         C 
            (x-2)(x-5)(x-1) = (x-2) + (x-5) + (x-1)

    .... and continue with Steps 4 - 9  (SOLUTION:  A = -7/3, B= 13/12, C= 5/4)

Repeated binomial factors?  Consider the highest degree of the repeated binomial and EVERY SMALLER DEGREE to set up the equation in Step 3....

                2x + 3             A         B           C    
            (x-2)(x-5)^2   = (x-2) + (x-5) + (x-5)^2

    ....and continue with Steps 4 - 9.  (SOLUTION:  A= 7/9, B= -7/9, C=13/3)

A quadratic factor?  If the denominator is quadratic, make the numerator of the fraction a binomial...

          2x + 3             A        Bx + C   
    (x-2)(x^2 - 5)   = (x-2) + (x^2 - 5)

    ....and continue with Steps 4 - 9.  (SOLUTION: A=-7, B=7, C=16)

 What if the Numerator is a higher degree than the Denominator? 
AHA!!  Another example of how simple algebra concepts are eventually used again as steps within more complex algorithms!!  To satisfy the requirement that Partial Fractions can only be constructed if the Numerator is a lower degree than the Denominator, we need to break up the rational expression even more by LONG DIVISION.  The Partial Fraction is constructed from the REMAINDER, expressed as a fraction with the divisor as the Denominator.

Wednesday, June 26, 2013

VECTORS IN A NUTSHELL


WHY SHOULD I LEARN ABOUT VECTORS?

After so many years of working with the same curriculum, I sometimes need to be convinced of the benefit of learning something new.  I’m relatively sure many students feel the same way.  So when it came time to expand the curriculum to include vectors, I was resistant.  However, a little research pointed out that many of my interests could benefit from understanding vectors.

Of course, vectors are found in science and engineering, but those disciplines have never prompted me to learn vectors in the past.  A math class problem made me realize that the football quarterback is thinking in vectors when calculating where to throw the ball and how much force to use to get it to the intended receiver.  In my youth, I thought of being a weather forecaster, and now I discover that vectors are needed to draw wind maps.  Fats Domino, famous pool player, was expert in calculating vectors to “drop the 5 ball in the corner pocket” by first hitting it with the 10 ball.  In helping a student study for the police exam, I found that investigators use vectors to describe the details of an accident.
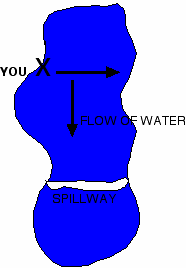
Our trigonometric experience with triangles is useful in determining the outcome of opposing forces described as vectors.  For example, you want to swim across the Rock River.  There's a spillway about 100 yards downstream from where you are.  Considering the rate at which the water is flowing, can you swim to the other side before falling over the spillway and possibly incurring bodily harm? We never thought about this when we, as teens, were swimming across the river, but maybe we should have.

Wow, maybe vectors ARE worth learning to prepare for a wide variety of experiences and careers.  So let’s get started...

WHAT IS A VECTOR?

In its most general description, a vector is a line which demonstrates 2 characteristics:
                LENGTH (called "magnitude")
                and
                DIRECTION, indicated by an arrow head at its terminal end

Here's a vector drawn on the coordinate plane:

It starts a S(1,2) and ends at T(6,5).

To find the Cartesian coordinates that would name this vector if it started at (0,0), we would subtract:
                   T - S
and, in this example,  get  (5,3).  From these coordinates, we can calculate the MAGNITUDE by using the Pythagorean Theorem:

                  magnitude, ||ST|| = √ (x^2 + y^2) = √ (5^2 + 3^2) = √( 34)

           Finding ||ST|| from the original components is just like the distance formula:
                                       ||ST|| = √[(6-1)^2 + (5-2)^2]

The coordinates also give us all the information necessary to determine the angle, or direction, of the vector:

                  Tan θ = y/x     or the longer way Tan θ = (5-2)/(6-1)
                                      Doesn’t that fraction look just like SLOPE?  


When the magnitude and direction are given as polar coordinates, (r, θ)....
....the x and y coordinates can be calculated using these equations:
              x = r(cos θ)
              y = r(sin θ)    (Remember from Trig....Cosine is the x axis, Sine is the y axis) 

COMPUTATIONS WITH VECTORS

ADDITION

Let Vector A = (3,8)
      Vector B = (2,4)

To add Vector A and Vector B for a RESULTANT Vector C:

    Add the x values.........3 + 2 = 5
    Add the y values.........8 + 4 = 12

The RESULTANT Vector C = (5,12)
with magnitude of 13.


SUBTRACTION

To subtract Vector B from Vector A for a RESULTANT Vector D:
  
     Subtract the x values.....3 - 2 = 1
     Subtract the y values.....8 - 4 = 4...........Vector D = (1,4) with magnitude of √17

SCALAR MULTIPLICATION

To increase a Vector by a given scale, multiply both x and y by the scale.

     5(Vector A) = 5(3,8) = (15,40)

DOT PRODUCT versus CROSS PRODUCT

DOT PRODUCT (sometimes called the SCALAR PRODUCT or INNER PRODUCT) is found by multiplying the x values together and the y values together and adding the two products.  The answer is a single number.

     Vector A (3,8) • Vector B (2,4) = (3)(2) + (8)(4) = 6 + 32 = 38

If the sum equals 0, the two lines are PERPENDICULAR.  WHY?!?
    Well, let's look at what we know from Algebra I.  If the slopes of two lines are opposite inverses, then the lines are perpendicular.  So, multiplying (as in the Dot Product) the numerator of two perpendicular slopes would be the additive inverse (opposite) of the product of the denominators.  Adding the two would result in a sum of zero.....ergo perpendicular lines. 

CROSS PRODUCT (sometimes called the OUTER PRODUCT)

     (Vector A) X (Vector B) = ||A||•||B||

Although Cross Product will not appear until later in the program, it is important to recognize the differences now, when we're talking about the Dot Product.  Dot Product can be completed on two vectors in a single plane; the Cross Product is only applicable in 3 dimensions.  It provides a vector perpendicular to two other vectors in a plane -- a vector perpendicular to that plane.  Cross Product involves matrices, so brush up on Cramer's Rule and determinants before we get to it later in the curriculum.

OTHER UPCOMING ISSUES WITH VECTORS 

Once we're comfortable with these basic vector concepts, we can explore more complex issues like unit vectors, resolving vectors into their components, vectors in 3 dimensions, and representing scalar values of unit vectors using i, j, and k.

Monday, August 27, 2012

Getting Ready for AP STATISTICS: LEVELS OF MEASUREMENT

Data can be separated into categories according to what is being measured and what information can be determined from the data.  Different levels of measurement are appropriate for different arithmetic and statistical operations. For example, it makes no sense to find the mean, median, or mode of a list of Social Security numbers.

NOMINAL

The nominal level of measurement is the lowest of the four ways to characterize data because it holds the least potential for instructive analysis. Nominal means "in name only" and nominal data deal with names, categories, or labels -- qualitative groups (see previous post: Getting Ready for AP STATISTICS: VOCABULARY BASICS).

Because data at the nominal level are qualitative, they can't be ordered in a meaningful way, and it makes no sense to calculate things such as the mean or standard deviation.

Examples:
Colors
Yes or no responses to a survey
Favorite class subject
Gender
Makes of cars  

Some number groups can be nominal:  the numbers assigned to marathon runners, for example, are used to identify or name the entrants.

 ORDINAL

The next level is called the ordinal level of measurement. Data at this level CAN be put in some order, but the differences between elements are not meaningful.

Letter grades in your classes are an example of ordinal measurement.  In some schools, a minimum of 94% is required for an A, but another school may count a 90% as an A.  It is not surprising that colleges have difficulty comparing applicants through letter grades alone, or even through class rank.  Both measures tell nothing about the difference between separate elements within a group.

As with the nominal level, data at the ordinal level should not be used in calculations.

Examples:
Movie ratings (G,P-G,PG13,R,NC17)
The Tonight Show’s “TOP 10” of anything
Classroom letter grades
IQ scores

INTERVAL

The third level of measurement is the Interval level.  It deals with data that CAN BE ORDERED, and in which differences between the data DO make sense.  It can be used meaningfully in calculations, but Interval level data DOES NOT HAVE A STARTING POINT.

Temperature for example can be put in increasing or decreasing order and the difference between 20 degrees and 80 degrees makes sense.  Zero degrees, however, does NOT mean a total absence of temperature.  Without a starting point, ratios of element values are meaningless.  An 80 degree day is not four times as hot as a 20 degree day.


Examples:
Temperature
Sea level
A college student's checking account balance (hopefully that's only a joke)

RATIO

The fourth and highest level of measurement is the ratio level where data possess all of the features of the other three levels and also a ZERO VALUE, so it makes sense to compare the ratios of measurements. Phrases such as "four times" and "twice" are meaningful at the ratio level.

Examples:
Monthly precipitation
Any system of measurement (length, weight, distance)


Since organizing data is a constant task in statistics, let's encapsulate characteristics of the four levels of measurement.


Notice that each level of measurement meets the criteria for the previous levels plus one more.

As you get further along in the curriculum, you will be introduced to essential statistical operations.  The level of measurement is an important factor in determining which
computations are viable.  Save the chart below for future reference and check your textbook glossary to reference each of the computations in the left column.


WHAT'S NEXT IN STATISTICS?
Now that we have some background and terminology, we can start developing a statistical survey.  Get a jump start on the classroom by thinking of a study you might want to conduct as a practical application.  Are you in another class (like American Politics during this election year) which would give extra credit for completing the survey?  What is your population?  What sample would be appropriate?  What would you measure?  How would you measure it?  Based on the chart above, what statistical computations would be possible?  Later in the curriculum, we'll investigate the information that can be garnered from the calculations.  For now....have fun!!


Sunday, August 26, 2012

PARAMETRIC EQUATIONS: Math Art

Even for those who are not enamored by the intricacies of math, the potential for entering an equation into a grapher and watching an incredible design appear can be appealing.  Parametric equations are the artists of the math world.


Parametric equations appear every now and then on the SATII, in Precalculus classes, and in Calculus as well.  These equations express two variables (usually x and y) each in terms of a third variable called the parameter (often t).

THE OBVIOUS SOLUTIONS
Given the parametric equations....

    x = t^2 + 3
    y = 2t

....a graph can be plotted by calculating values of (x,y) in a three column chart.

    t      x     y
    0     3     0
    1     4     2
    2     7     4
    3    12    6
    4    19    8
    5    28    10

USING OUR ALGEBRA SKILLS
Many parametric equations can also be manipulated algebraically to form a single rectangular equation which may be easier to graph.   

    Solving for t in terms of either x or y in the example above and
    substituting into the alternate equation gives the function...

    y = 2 sqrt (x-3)


A SPECIAL CAUTION WHEN ELIMINATING THE PARAMETER

Caution should be taken to preserve the range of the original equations when eliminating a parameter.  In this example, the range of x is all real numbers greater than or equal to 3.  Luckily, this exclusion on x is also accounted for in the rectangular equation because of the square root.

But consider...

    x = t^2
    y = 3t^2 + 4

In this case, x doesn’t fall below 0 and y doesn’t fall below 4.  So the graph of the parametric equations is truncated below (0,4).

PARAMETERS CAN DO WHAT FUNCTIONS NEVER WILL
Many interesting shapes cannot be graphed as functions because they don’t pass the vertical line test.  Parametric Equations can be used to graph geometric figures like conics.

The Cartesian equation for a circle, x^2 + y^2 = r^2, can easily be converted to parametrics as
    x = r cos t
    y = r sin t

RECOGNIZE CHARACTERISTICS OF PARAMETRICS

Here are some “expectations” for parametric equations.

1.  x = sin t, y = cos t  represents a point moving clockwise around the unit circle.

2.  x = cos t, y = sin t describes the point moving counter-clockwise around the unit circle.
   
3.  x = t, y = t^2 signals a parabola

4.  x = t^2, y = t  in function form graphs as a square root

RELEASE THE ARTIST WITHIN
YouTube has a plethora of examples of exciting, artful parametric equations to program into a graphing calculator.  Here’s one that draws a butterfly......

    x = sin(t) (e^(cos(t)) - 2 cos (4t) - (sin (t/12))^5)
    y = cos(t) (e^(cos(t)) - 2 cos (4t) - (sin (t/12))^5)

Have fun!!

Saturday, August 18, 2012

Getting Ready for AP STATISTICS: VOCABULARY BASICS

As you start the study of statistics, you will find topics and equations that you have studied in previous classes.  Mean-median-mode, for example, should quickly bring to mind average-middlemost-most frequent.  Other familiar terms have unique definitions for statistics class.  Meanings aren’t as much “different” as they are more “specific” and carry definite implications. 

What follows is not a complete list, but rather a sampling of the vocabulary with explicit meanings in the course.  There are only 10 here to get you started and a suggestion for continuing to prepare for AP Stats on your own.

Population: The complete set of data elements is termed the population.

Sample: A sample is a portion of a population selected for further analysis.

Parameter: A parameter is a characteristic of the whole population.

Statistic: A statistic is a characteristic of the sample.

                 Notice that the P’s are associated with each other and 
                 the S’s are associated with each other:  
                 Parameter is to Population as Statistic is to Sample

Individual refers to the elements in a set

Variable refers to the characteristics describing individual elements of a set.

Qualitative data are non-numeric or categorical data.

Quantitative data are numeric and can be either Discrete or Continuous.

     Discrete: numeric data that have a finite number of possible values.  When opinion surveys evaluate answers like “Strongly disagree, Disagree, Neither disagree or agree, Agree, Strongly agree, each possible answer is given a discrete numeric value so meaningful statistical computations can be made.  The same information could be gathered through options like “on a scale of 1 to 5...”

Data counts are always discrete: for example, the number of students enrolled in your statistics classes.

     Continuous: numeric data that have infinite possibilities: the set of all counting numbers or the set of all real, rational numbers between 1 and 2.


If you already have your textbook, look at the glossary to find other terms that you've run into before.  Read definitions to identify how these words might be similar and/or different from your past encounters with them. 

Saturday, August 11, 2012

Getting Ready for AP STATISTICS: MEAN-MEDIAN-MODE


MEAN - MEDIAN - MODE

For those of us preparing to earn a 5 on the AP Statistics exam next spring, calculating mean - median - mode should be as natural as eating ice cream on a hot summer’s day.  The measures of central tendency were introduced in upper elementary math classes, but it isn’t until now that the various uses have important implications.  

CALCULATING MEASURES OF CENTRAL TENDENCY

MEAN is the same as “average”  or “arithmetic mean.”
     Add all of the elements and divide the sum by the number of elements.

MEDIAN is the middlemost.  Think of the middle of the street...that’s the median. 
One very easy way to find the median in a small group is to first put all numbers in ascending order. Then count from the right and left simultaneously until you get to the middle.

If there are an odd number of elements, there will be one in the middle that can’t be matched from both the right and left......the median.

If there are an even number of elements, the median is the AVERAGE of the two in the middle.

MODE is the most frequently appearing element.

USING CENTRAL TENDENCY TO DESCRIBE DATA

In Statistics, these measures are used to describe the “typical” element and the relative usefulness of each is determined by the level of measurement.  (Watch this site for an upcoming blog, "Getting Ready for AP Statistics: Levels of Measurement" and share examples with other followers.)

NOMINAL (entries are categories or qualitative data)......MODE

ORDINAL (qualitative or quantitative data)....................MEDIAN

INTERVAL (quantitative data)
--- Symmetric.............................................................MEAN
--- Skewed.................................................................MEDIAN


RATIO (quantitative data)
--- Symmetric.............................................................MEAN
--- Skewed.................................................................MEDIAN

A MEAN is useful only for interval or ratio data.  It considers all of the elements in the sample and is influenced by outliers.  The mean is pulled toward an extreme.

A MEDIAN is useful for all quantitative data: ordinal, interval, and ratio levels and is not effected by an extreme outlier.

A MODE is the only useful descriptor for nominal measurements.  It can be applied in all levels of measurement but may not exist or be meaningful in all cases.

 MEAN - MEDIAN - MODE ON A FREQUENCY GRAPH


USING A CALCULATOR FOR RECORDING MEAN - MEDIAN 

If you're using a TI-84 or similar grapher, check out the "LIST" and "STAT" buttons.  There are options for finding mean and median after listing the elements in a set.  While you're at it, find the owner's manual for the calculator you'll be using in class and look over the directions for inputting a list and calculating various statistical values.

Keep watching this site for more "Previews" of AP Stats, AP Calc, and other classroom courses.  Let's be prepared before school resumes!